 SightMill
Anna Answers
Got a question? Our customer success expert Anna provides the answers!
About Anna
Introducing Anna - who heads up our customer success team. Anna's passionate about helping businesses improve the customer experience - by providing real-world examples that can fit in with your communications and marketing strategy.
answers@sightmill.comWhat's your question?
A: Customer review sites are incredibly powerful buying aids to help potential customers get what's called 'social proof' about a product from other customers. They work on the same principal as you trusting what your friend says about a new restaurant rather than the restaurant's own website. TrustPilot is a fantatic resource for consumers to help them make informed buying choices.
NPS, in comparison, is used to help your business understand the customer's experience of using your business and products. You can then use NPS data to improve the service you offer your customers and ensure that they're happy customers who act as your ambassadors and spread the word about how great it is to deal with you and your products.
Best wishes, Anna.
Find more detailed information in our blog and help center
A: The temptation is to try and measure lots of different points and customer groups all at once, but you might then find it difficult to work out what needs to change to improve customer experience.
We've found that using feedback surveys on a website can be an effective way of understanding the customer experience to a specific feature or process (eg if you change a function or re-design, or want to improve your e-commerce process).
For email surveys, it's generally better to send to broader groups to get a wider distribution of feedback. For example, if you have 1,000 customers to one product in three different countries then it's worth sending three different emails to the groups in each country. If you have 100 customers in 20 States, it is too small a sample size to better to send to the whole customer base to avoid misunderstanding results.
Even if you survey a bigger, broader group of customers, you can use the Tags feature of SightMill to split this afterwards by type of response, or by product used, or price point, or sales rep.
Best wishes, Anna.
Find more detailed information in our blog and help center
A: Yes, absolutely! After you updgrade your account, all your settings and data remain in place so you can continue your campaigns.
For email and event surveys, you can add your logo and format the surveys. For all surveys, you can edit text and colors to match your brand.
Best wishes, Anna.
Find more detailed information in our blog and help center
A: There are a couple of ways to view this information.
Summary: For a summary, open your survey Project and look at the Dashboard. In the top-right, you'll see a box titled 'Surveys'. You can select a date range and it displays the number of responses (middle column) with number of surveys displayed (the 'n' value) for each channel of web, email, and event.
Detail: To view the detail of number of times a survey is displayed or sent to a recipient versus the number of responses, look at the Trends tab on your Dashboard. You'll see a graph titled 'Daily Number of Respondants by Channel' - select the date range and you'll see the number of surveys vs the number of respondants by day.
The first summary is great to get a snapshot of how effective your campaign is. The second helps you work out on which day your recipients are most responsive (eg Tuesdays).
Best wishes, Anna.
Find more detailed information in our blog and help center
A: Take a look at the question on response rates - typically, we see response rates of between 15-25% for email surveys and 20-30% for web surveys. And we see around 10% of respondants provide additional (verbatim) comments.
EMAIL: If your response rates to your email surveys are a lot lower than this, it's worth looking at your subject line, the number of other emails you are sending this group of recipients.
WEB: Web surveys placed mid-way through a series of steps (eg mid-way through an e-commerce checkout process) will likely have low response rates as visitors are concentrating on the process. Similarly, surveys on the main homepage will have lower response rates than a survey behind a paywall as plenty of visitors to your homepage will simply 'bounce' (ie move on to another site) without engaging, since they are in browse mode.
Best wishes, Anna.
Find more detailed information in our blog and help center
A: There are a couple of settings that you can use with web surveys. The first lets you define how long to wait once a visitor lands on a page and before displaying a survey. The second setting lets you define how long to wait before displaying the survey again if the same visitor views the page again.
These are both there to make sure that you don't bombard visitors to your website with surveys.
Let's start with the delay. The ideal is that you allow a visitor time to absorb most of the information on the page before displaying the survey. This will vary according to what's on the page.
For example:
1. If it's a 'thank you' page after the payment process in an e-commerce site, then you should display the survey immediately - the visitor can read the page in a second.
2. If it's a blog article that takes 30seconds to read, you might want to wait for 20seconds before displaying the survey to allow visitors a chance to start reading the material.
3. If it's a general information page within your website and is likely to be one of several browsed during a session, then a delay of two or three seconds will ensure a visitor can start to engage with the material.
Best wishes, Anna.
Find more detailed information in our blog and help center
A: No problem - thankfully, it's a simple equation that is calculated by subtracting the percentage of detractors from the percentage of promoters who have responded to a standard NPS (Net Promoter Score) question... but hang on, that sounds quite complicated.
Let me explain these various elements, and I'll start with what is a standard NPS question: it's deceptively simple and is worded as:
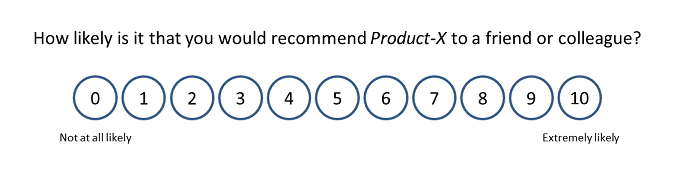
Those viewing the survey question see a scale of 0-10 (where 0=not at all likely to recommend the product, and 10=extremely likely to recommend the product).
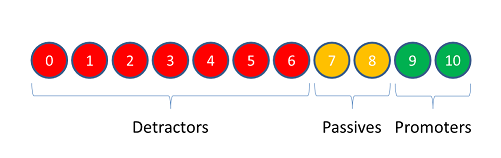
In the NPS methodology, responses are organized into three groups that are based on the scoring:
Scores of 0-6 are called detractors
Scores of 7-8 are called passives
Scores of 9-10 are called promoters
So, finally to your question: the NPS score is calculated by subtracting the percentage of detractors from the percentage of promoters; we ignore the passives for the calculation.
The NPS score is displayed as a number (not as a percentage) and can be within the range of -100 to +100.
Here's a worked example:
Let's take a look at how to calculate the NPS for responses to your survey over the course of a day. In this example, you've had 10 respondents and they have given your product the following scores:
3, 4, 5, 6, 8, 8, 8, 9, 10, 10
If we arrange these into detractors, passives and promoters, this equates to:
four detractors (3, 4, 5, 6), ie 40% of the responses
three passives (8, 8, 8), ie 30% of the responses
three promoters (9, 10, 10), ie 30% of the responses
So the day's NPS = -10 (calculated by: 30% promoters - 40% detractors = -10)
Best wishes, Anna.
Find more detailed information in our blog and help center
Hi - a great question, and one that's incredibly important when thinking about your customer base, the type of survey to use and what is a good number of survey responses.
We've found that the response rates for the three different formats of NPS (Net Promoter Score) survey vary a lot across email NPS surveys, website or in-app surveys, and running surveys at your event, training or conference.
Event-based NPS surveys:
We would expect companies using our event NPS survey to get a response rate of between 80-95% - it gets higher for training sessions and lower for general conferences. However, these incredibly high response rates are not surprising since you are likely to have a room-full of delegates and they have just spent time with a trainer, lecturer or speaker.
Website or in-app NPS surveys:
Adding an NPS survey to your website, so it is displayed to visitors on a particular page or section, is a fast, easy to implement way of gathering customer data - and, in our experience, sees the second highest response rates of around 20-30%.
Of course, this also depends a little on where you place the survey - for example, place it just after a visitor has completed an order and paid and you're likely to get higher response rates; add it to a general page (such as the contact-us page) and you're likely to see lower response rates.
Email NPS surveys:
If you use the SightMill email feature that embeds an NPS survey into the email so a recipient just clicks on their score from within their email client (such as Outlook), we would expect a response rate of around 15-25%. If you just email a link to a survey hosted on a website, these response rates will tumble to just a few percent.
I'm assuming here that you've spent some time writing a great email subject line and thought about the design and layout - I'll come on to these later.
Improving response rates
It's really important to try and increase your response rates since the more responses you have, the more statistically significant the results and the more you will have a balanced set of results rather than just those of outliers.
There are plenty of ways you can easily drag-down your response rates - for example, sending out an email with a confusing subject line or at the wrong time of day, or adding a website survey to a low-traffic section of your website, such as the about-us page.
You'll probably find that the first customers to respond to a survey will be those that had a terrible or brilliant experience. You absolutely must capture and act on the negative detractor feedback but it can be biased for a range of reasons (for example, you have just put through a price increase, or due to internal issues out of your control at their company).
Here are a few great tips to help improve your response rates.
1. Make the email survey trusted and seamless. Make sure you setup SightMill to send using your company email address that the customer recognises and use the default in-bedded surveys that will record a response without the user leaving their email client.
2. Personalise your email survey to include your company or product brand logo and personalisation.
3. Make your NPS website survey experience is seamless. Edit the colors and text to reflect your website look and feel (and language - we support multiple languages).
4. Don't over-do the survey experience and typically send an email survey once every three or six months and on your website no more than once every three or six months for a returning visitor.
Best wishes, Anna.
Find more detailed information in our blog and help center
Hi - a great question, and one that's incredibly important when thinking about your customer base, the type of survey to use and what is a good number of survey responses.
So you've been reading up on NPS scores, and we're keen on using a NPS tool to identify customer sentiment and improve customer service. Before you get jump in, it's important to determine what exactly is a good NPS score, and set a target NPS score that you want to achieve.
Most marketers consider a score between 0 and 50 to be 'good', a score of 51 to 70 to be 'excellent', and anything beyond that to be 'world class'. But we find that these benchmarks are far too generic; companies who take these benchmarks at face value might either lull themselves into a false sense of security, or panic unnecessarily.
How should you gauge whether your NPS score is good, then? We find that looking at NPS scores in the context of specific industries is far more effective. For instance, here are average NPS scores for various industries as shown on NPSBenchmarks:
- Leisure, Travel & Tourism industry: 54
- Fast Moving Consumer Goods: 31
- Healthcare: 76
- Technology: 59
- Education: 69
- Entertainment: 22
- Financial services: 46
As you can see, there's quite a bit of variation in these average NPS scores. The Entertainment industry and the Healthcare industry, for example, are on opposite ends of the spectrum.
Intuitively speaking, we can see how this makes sense. Given that consumers seeking out healthcare services have more at stake than those who are buying entertainment-related products and services, they'd naturally expect a higher level of service, and this sets a certain standard of healthcare companies to live up to.
Of course, regardless of which industry you're in, having a high NPS score will definitely help you stand out from the crowd. Take adidas for example - the sportswear brand has an NPS score of +49, which is significantly higher than that of its competitors (Nike, for example, has an NPS score of +32).
Adidas started measuring their NPS score back in 2015, and back in 2016, they even formed 'Experience NPS Panel' which focused on obtaining customer feedback, and using this feedback to drive improvements and business directions.
Here's the best part: having a 'consumer-obsessed mindset' resulted in a direct impact on adidas' bottomline. After investing the time and effort into improving their NPS score, adidas saw their revenues shoot through the roof. In 2016 alone, its net income was up by an impressive 38%, and in 2017, the company also experienced a greater increase in its profits as compared to competitors such as Nike, Puma and Under Armour.
Best wishes, Anna.
Find more detailed information in our blog and help center
A: The Net Promoter Score (NPS) survey is a one-question survey that asks your customers how likely they are to recommend you to a friend, and buckets them into three different groups (Promoters, Passives, and Detractors) based on their responses. While the NPS survey is a great way to understand customer sentiment, and gauge how you're doing in terms of customer satisfaction, that's not all that it's good for.
You can also use your NPS survey to do plenty of other things... such as identifying brand advocates, and increasing the number of customers you get from word-of-mouth. How do you do this? Instead of letting your NPS survey run on autopilot, and calling it a day, you'll want to follow up and re-engage with your Promoters, Passives, and Detractors. More specifically, here are 3 things that you should do:
1. Enlist your Promoters as brand advocates
Your Promoters already love your business and brand, so it makes sense to enlist them as your brand advocates, and get them to promote your company.
There are various ways you can do this. If you're looking for a more informal arrangement, you can invite these folks to special events (eg food tastings if you're a F&B brand), and get them to post on their social media and use your branded hashtags in exchange. On the other end of the spectrum, you can also set up an affiliate marketing arrangement, which means that your brand advocates or affiliate marketers get to keep a certain percentage of the sales that they bring you through their promotional posts.
2. Perform service recovery with your Detractors
Say your NPS email gets sent out to a hundred people (on average!) per day, and out of all these folks, approximately 20 will turn out to be Detractors. These 20 people are essentially ticking time bombs, waiting to explode.
You already know that consumers have the power to do a massive amount of damage on social media. In this day and age, it's highly common for people to take to their Facebook page to rant about a brand that they feel has done them an injustice. Bearing this in mind, companies need to go all out to resolve customer complaints, and make sure there isn't any lingering unhappiness. So make sure you reach out to your detractors, and perform service recovery.
At the end of the day, it really doesn't matter who's in the right, and who's in the wrong. As Warren Buffet puts it, it takes 20 years to build a reputation, and five minutes to ruin it. Don't let you or your team's pride or ego get in the way of growing your company!
3. Get to know your Passives better
Plenty of companies will reach out to their Promoters and Detractors, but conveniently ignore the Passives, who are the group of consumers sandwiched in the middle. But here's the thing: you should be actively trying to win over your Passives, so that you can convert them into Promoters. When it comes to Promoters, more is definitely more!
To do this, you'll have to get to know your Passives better, and understand what makes them tick. We recommend triggering a follow-up email to all your Passives, and asking them what would convince them to be a loyal customer of your store. Yes, you can find plenty of statistics online that tell you adding a 100% Money Back Guarantee badge on your website will increase conversion rates by 32%, or that 48% of shoppers would shop more with online retailers that offer hassle-free returns. But remember: there's no one-size-fits-all solution when it comes to entrepreneurship and business.
Bottom line? It's far better to hear from your own customers as opposed to blindly trusting third-party research. So get in touch with your Passives, and start picking their brains!
Following up after your NPS survey
Following up with your Promoters, Passives and Detractors can help you reduce churn, increase retention, and reach out to new customers. Want to start reaching out to your consumers and taking your customer service to the next level? Make sure you have a customer feedback platform in place and your teams are empowered to really help customers.
Best wishes, Anna.
Find more detailed information in our blog and help center